advanced
The Heikin-Ashi technique can be used in conjunction with candlestick charts when trading securities to spot market trends and predict future prices.

Heikin-Ashi

H

Heikin-Ashi, also sometimes spelled Heiken-Ashi, means “average bar” in Japanese. The Heikin-Ashi technique can be used in conjunction with candlestick charts when trading securities to spot market trends and predict future prices. It’s useful for making candlestick charts more readable and trends easier to analyze.

For example, traders can use Heikin-Ashi charts to know when to stay in trades while a trend persists but get out when the trend pauses or reverses. 

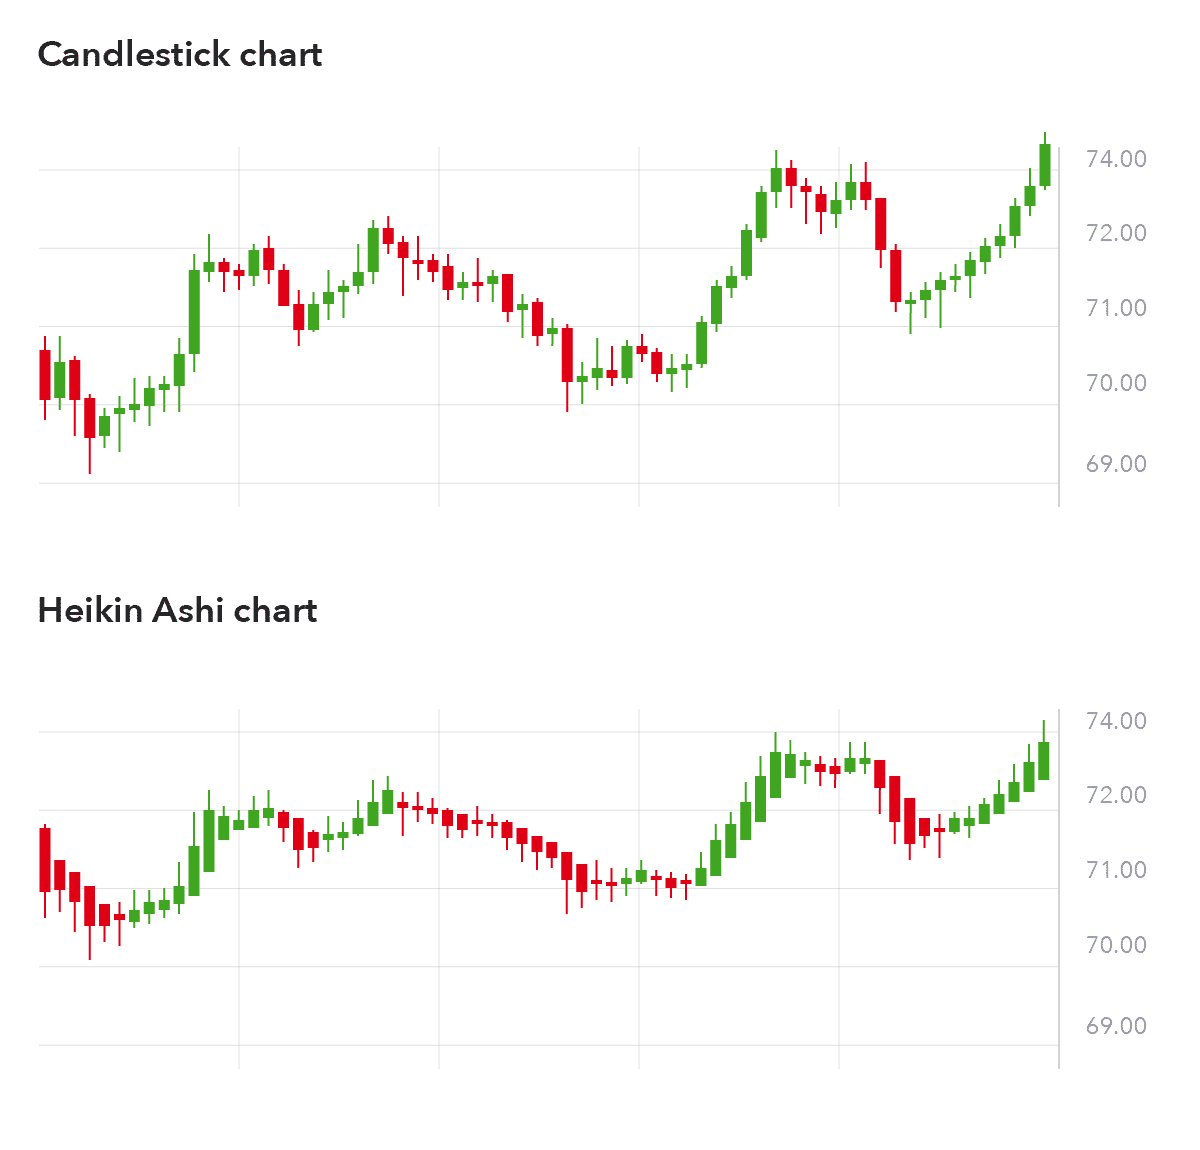
Heikin Ashi charts are similar to a candlestick charts A candlestick chart is a type of financial chart that graphically represents the price moves of an asset for a given timeframe. a type of financial chart that graphically represents the price moves of an asset for a given timeframeLearn more, but the main difference is that a Heikin Ashi chart uses the daily price averages to show the median price movement of an asset. The bars in a Heikin Ashi chart are calculated from an average of the open, close, high and low of previous trading sessions.

Normal candlestick charts are composed of a series of open-high-low-close (OHLC) candles set apart by a time series. The Heikin-Ashi technique uses a modified formula of close-open-high-low (COHL).

Heikin Ashi chart

Heikin-Ashi has a smoother look because it is essentially taking an average of the movement. There is a tendency with Heikin-Ashi for the candles to stay red during a downtrend and green during an uptrend, whereas normal candlesticks alternate color even if the price is moving dominantly in one direction.

Because Heikin-Ashi is taking an average, the current price on the candle may not match the price at which the market is actually trading. For this reason, many charting platforms show two prices on the Y-axis: one for the calculation of the Heiken-Ashi and another for the current price of the asset.

There are five primary signals that identify trends and buying opportunities:

Hollow or green candles with no lower "shadows" indicate a strong uptrend: Let your profits ride!

Hollow or green candles signify an uptrend: You might want to add to your long position and exit short positions.

Candles with a small body surrounded by upper and lower shadows indicate a trend change: Risk-loving traders might buy or sell here, while others will wait for confirmation before going long or short.

Filled or red candles indicate a downtrend: You might want to add to your short position and exit long positions.

Filled or red candles with no higher shadows identify a strong downtrend: Stay short until there's a change in trend.

These signals may make locating trends or trading opportunities easier than with traditional candlesticks. The trends are not interrupted by false signals as often and are thus more easily spotted.

heikin-ashi