


The slope of the yield curve gives an idea of future interest rate changes and economic activity.
A yield curve is a way to measure bond investors’ feelings about risk, and can have a tremendous impact on the returns you receive on your investments.
There are three main shapes of yield curve shapes: normal (upward sloping curve), inverted (downward sloping curve), and flat.
Upward sloping (also known as normal yield curves) is where longer-term bonds have higher yields than short-term ones.
While normal curves point to economic expansion, downward sloping (inverted) curves point to economic recession.
A yield curve is used as a benchmark for other debt in the market, such as mortgage rates or bank lending rates, and it is used to predict changes in economic output and growth.
The most frequently reported yield curve compares the three-month, two-year, five-year, 10-year, and 30-year U.S. Treasury debt. The Treasury yield curve is often referred to as a proxy for investor sentiment on the direction of the economy.
Types of Yield Curves
Yield curves take on different shapes depending on the state of the individual bond market and the economy overall.
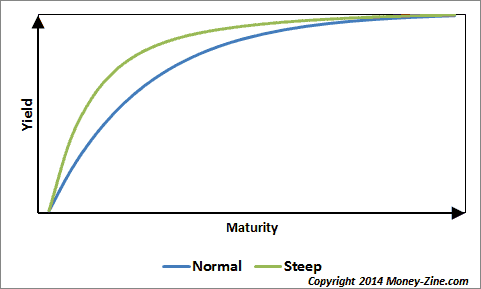
Normal Yield Curve
A normal yield curve slopes up and to the right as yields increase with maturity. This indicates that market conditions and the economy as a whole are healthy and functioning normally.
In short, yields are distributed this way because in an ideal world investors want to be compensated more for having their money tied up for the long term. That means issuers must provide a so-called liquidity premium that grants longer-term maturities higher yields.

Steep Yield Curve
A steep yield curve looks like a normal yield curve but with a steeper slope. Market conditions are similar for normal and steep yield curves. But a steeper curve suggests investors expect better market conditions to prevail over the longer term, which widens the difference between short-term and long-term yields.
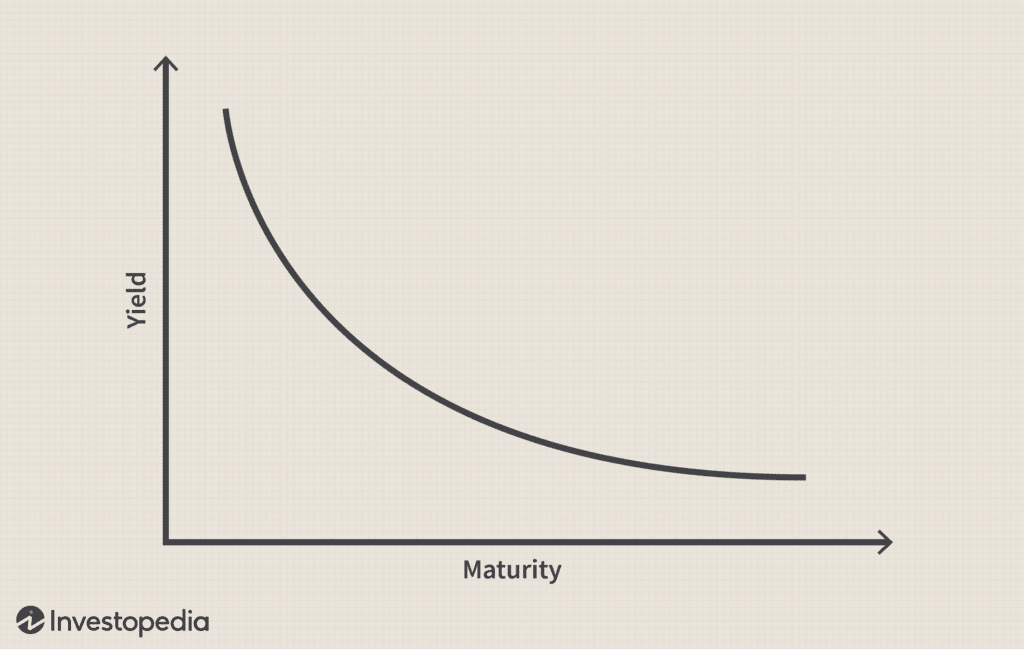
Inverted Yield Curve
When the rates for shorter-term maturities are higher than those for longer-term maturities, that creates an inverted yield curve. This can indicate a recession or bear market, where the market may experience prolonged declines in bond prices and yields.
Flat Yield Curve
When yields for shorter-term and longer-term maturities are essentially the same, that creates a flat yield curve. Flat yield curves often have an elevated portion in the middle, wherein the mid-term maturities have a higher yield than either short- or long-term maturities. This is called the humped yield curve.
A flat or humped yield curve may be a precursor to an inverted yield curve, but that is not necessarily the case with every flattening of the yield curve.
What Is Yield Curve Risk?
Yield curve risk refers to the risk investors of fixed-income instruments (such as bonds) experience from an adverse shift in interest rates. Yield curve risk stems from the fact that bond prices and interest rates have an inverse relationship to one another.
For example, the price of bonds will decrease when market interest rates increase. Conversely, when interest rates (or yields) decrease, bond prices increase.
Treasury's yield curve rates


Yield Curves Explained and How to Use Them in Investing


What is a yield curve?
Understanding The Yield Curve
Any informed borrower is simply less vulnerable to fraud and abuse.


