
IA TA Tuesdays (InvestAnswers Technical Analysis) – today we cover simple moving averages or moving averages to identify buy and sell signals and how I configure my charts including the rules of engagement. We also cover stop losses and so much more across Bitcoin, Ethereum, Gold, Ten Year Treasury, Twitter, Shopify, Nextera Energy, Nio, Tesla, Google, and more.
The opinions expressed in the video are for general informational purposes only and are not intended to provide specific advice or recommendations for any individual or on any specific security or investment product. It is only intended to provide education about the financial industry.
0:00 IA TA Tuesdays SMA Simple Moving Avg
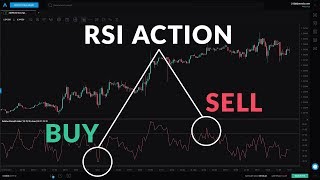
0:50 Why TA MA (Moving Averages) For time series interpretation, a moving average can smooth out the noise of random outliers and emphasize long-term trends Used to identify trend direction and to determine support & resistance levels
1:20 Do Moving Averages Work? The market has no memory and the past is not an indicator of the future Standalone it is not perfect. MA’s lag the market
2:00 Long Term – The 200 DMA Trending below the 200 DMA = bearish sign – think short the market If it is above – think bullish
2:40 Medium Term 50-100 DMA The 50-day average is a key level of support or resistance it’s the first line of support in an uptrend. the first line of resistance in a downtrend
3:15 Short Term 20 DMA The 20-day may be of analytical benefit to a shorter-term trader since it follows the price more closely and therefore produces less “lag” than the longer-term moving average
4:00 When 50MA Crosses Above 200MA = Buy Signal A very bullish sign But check other market conditions and other indicators Never rely solely on MA’s
5:00 Golden Signal 50 Day MA crossing a line of support is a very bullish sign Use daily and 4-hour charts to check
5:20 Trailing Stop Losses 50 DMA can also be used for trailing stops.
6:00 Don’t use Trailing Stop Losses for CRYPTO – You will get #Wicked out
7:00 Chart analysis for Bitcoin, Ethereum, Gold, Ten Year Treasury, Twitter, Shopify, Nextera Energy, Nio, Tesla, Google, and more.
20:16 Conclusion Moving Averages In an up market, when great names hit 200 DMA’s – worth investigating. 50 DMA act as good lines of support, Stop losses can be placed under 50 DMA’s for safety, MA’s can give good buy and sell signals BUT tend to lag, Practice practice practice and get to know the Snake!
21:17 Want more? (you know what to do!)
21:35 Patreon.com / InvestAnswers Join the IA Community
21.50 SCAMMERS ME (see the name bubble)