


The Ichimoku Cloud is a collection of technical indicators that show support and resistance levels, as well as momentum and trend direction. It does this by taking multiple averages and plotting them on a chart. It also uses these figures to compute a “cloud” that attempts to forecast where the price may find support or resistance in the future.
In Japanese, it is called the ‘Ichimoku Kinko Hyo’ which roughly means ‘one look equilibrium chart’ – because with just one look, traders can receive a range of information.
The Ichimoku Cloud was developed by Goichi Hosoda, a Japanese journalist, and published in the late 1960s. It provides more data points than the standard candlestick chart.
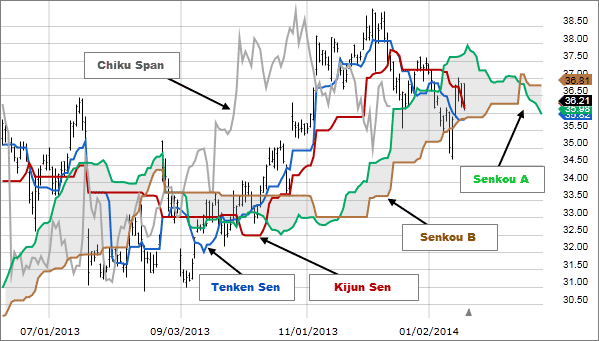
The Ichimoku Cloud indicator is made up of five lines or ‘plots’:
The Tenkan-sen, known as the conversion line, is the nine-period high plus the nine-period low, divided by two. This is the midpoint of the 9-day high-low range, which means that the line spans just under two weeks.
The Kijun-sen, known as the base line, is the 26-period high plus the 26-period low, divided by two. This line is the midpoint of the 26-day high-low range
The Senkou Span A, known as the leading span A, is the conversion line plus the base line, divided by two. The leading span A marks the midpoint between the two lines, and forms the upper of the two cloud boundaries
The Senkou Span B, known as the leading span B, is the 52-period high plus the 52-period low, divided by two. As the midpoint of the 52-week range, this line plots just under three months and forms the lower cloud boundary
The Chikou Span, known as the lagging span, shows the closing levels plotted 26 days in the past
The cloud is a key part of the indicator. When the price is below the cloud, the trend is down. When the price is above the cloud, the trend is up.
Traders will often use the Ichimoku Cloud as an area of support and resistance depending on the relative location of the price. The cloud provides support/resistance levels that can be projected into the future. This sets the Ichimoku Cloud apart from many other technical indicators that only provide support and resistance levels for the current date and time.
When the actual cloud aspect of the Ichimoku indicator appears on a chart, it is as two lines filled with a colour. If the Senkou span A is above the Senkou span B on the chart, this indicates an upward trend and the cloud will appear green in colour. If the Senkou span B is above the Senkou span A, this indicates a predominantly downward trend and the cloud will appear red in colour.
The price line itself will appear above the cloud when the trend is up, and below the line if the trend is downward. If the price line sits within the cloud, it is assumed that the trend is ‘flat’ or horizontal.


The desire to perform all the time is usually a barrier to performing over time.


